The role list and single role view for a person includes charts indicating how that person is developing over time. In the context of the Platform, development is measured as a change in familiarity with role expectations.
There are two charts indicating changes in awareness and familiarity respectively. They are displayed at the top of the role list of a person, and at the bottom of the single role view of a person.
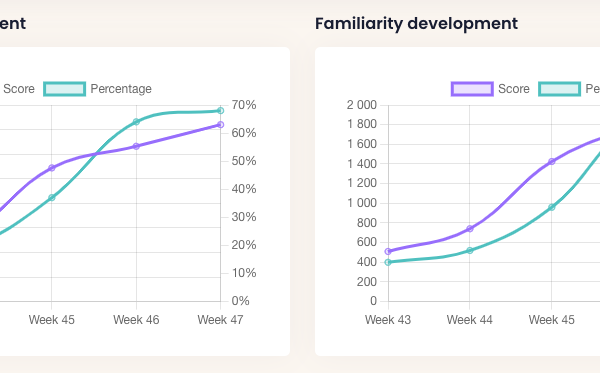
Each chart has two Y (vertical) axis.
The left axis corresponds with the purple line and displays the score over time. This number is always expected to grow unless someone deletes or downgrades their familiarity.
The right axis corresponds with the green line and displays the percentage over time. This number will increase when familiarity is set/upgraded and drops when additional expectations are added to the roles assigned to that person.